With all Power Meters, Power Quality Analyzers, Energy Loggers or Power Loggers you can measure quite a number of Power parameters. In fact, the number of variables these instruments can measure, log and store is in many cases overwhelming. Imagine yourself setting up, downloading and analyzing a 32GB file with a logging of 500+ parameters over a month period…..
So, wishing for “I want to log everything” is in most cases not the best idea, and certainly not the most efficient way. This leaves us with the question how to determine which data we need to collect to get the results we need?
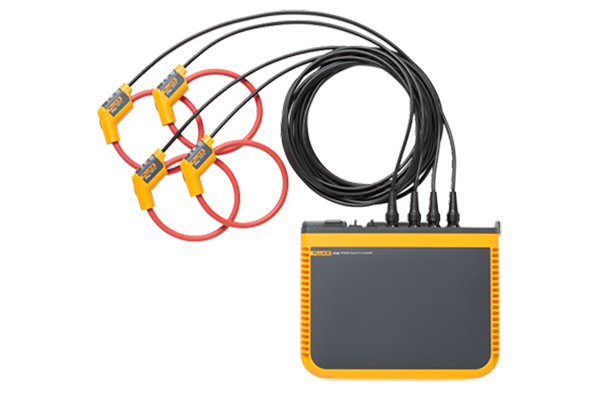
In this blog, we will look at the way we can collect data with the Fluke 1748 Power Quality Logger.

Why should I measure?
Regardless the reason you want to measure something in any application, first question you should ask yourself: “Why should I measure?” And the second right after that is “What should I measure?”.
The only reason you would want to measure anything is to find the cause of a problem, or to verify a problem being solved. So, it all starts with the reason why you want to measure.
Imagine you have production quality issues that, as you suspect, are caused by an inferior quality of supplied power. You think either the voltage is too low sometimes or you might experience dips etc. causing your production to halt or affect quality. A good starting point is to check if the power supplied to your building has the minimum quality level as laid down in the EN50160 regulation.
How to collect data?
Now we know why we want to collect data, but then what parameters should I measure and for how long? In this case we want to verify that the power we get complies with the EN50160 standard. In that case we need to measure at the PCC (point of common coupling), The PCC is the plane where the supplied voltage is connected to the consumer of that voltage. A utility will measure at the point the cable to the consumer leaves the substation. We, the normal users, do not have access to that point, so we only can measure on the same cable at the point it enters your building; AKA your main distribution panel.

According EN50160 we need to measure all parameters listed in the EN50160 standard in the specified interval for a full week. Luckily you do not have to buy the EN50160 standard, analyze it and set up every parameter yourself. The Fluke 1748 has the required measurements and intervals already available as a default.
Measuring and downloading
You connect the Fluke 1748 to your main distribution panel, as close to the feeder cable as possible but behind the first safety device. Clip on your current clamps and power your Fluke 1748. Connect your PC to the Fluke 1748, through USB WiFi or Ethernet, and walk through the very easy to understand setup and start your measurement. You can also pre-program the Fluke 1748 to start the required measurement at startup. Advantage of the PC connection is your measurement connection check where, in case of wrong connections or reversed current clamps, you can correct this electronically. So, you do not have to put your gloves and mask back on to physically change your connections.

After a week, you come back with your PC, connect to the Fluke 1748 again and download the measurement.

Data collected, now what?
Now you have the data you need, so next step is to analyze the data with the accompanying software. As you hopefully agree, the data collection part is straightforward once you know WHY and WHERE you want to measure. The analysis of the data and cross referencing the analysis to real events in your facility is the hard(er) part that leads to the root cause. This however will be the topic of a next blog.
Summarizing data collection with the Fluke 1748, or any other Power Quality Analyzer:
- Define first WHY you want to measure or log
- Define WHERE you need to measure
- Set up the measurement in your instrument and connect it safely
- Let the instrument measure for the required time frame
- Download the collected data to be analyzed with the accompanying software
- Cross reference the outcomes of your analysis with real life events in your facility