When assessing control valves and their performance, you need to understand the different types of valves and what they can be tested for. For open/close shutoff valves without analog control the tests are pretty simple. Do the valves open and close? When open, do they open all the way? When they close, do they close completely? Testing is mostly observational: looking at the valve and watching cause and effect in the process during the cycle.
Control valves are a different "beast" altogether
These valves open and close proportionally, and vary the degree of travel depending on the percent of span of the 4 to 20 mA signal applied to them. Observing the valve's position, as reported on the visual travel indicator, gives the technician or operator a rough indication of percent of travel for a particular setting when in operation - but does not provide any assurance of how the valve will operate under dynamic and changing conditions.
The most sophisticated valve performance tests require removing the valve and testing its performance on a "valve prover." This is an expensive test device, out of range for most instrument shops. The valve prover is often only used by valve manufacturers in testing the valve when shipped, or by highly qualified field service engineers. It offers a very complete test, but the tool is not feasible for most instrument shops.

So, what is the technician to use for testing a control valve?
What is a meaningful test that can be used as a baseline? Since most valves use a 4 to 20 mA input signal, any test tool with an mA output signal can provide the input mA signal to drive the control valve across its operating range. When applying a 3.8 mA input signal to a normally closed valve, the valve should be hard closed. It should remain closed at 4.0 mA and move slightly off its seat at 4.2 mA. At the other end of its operation, at 19.8 mA, it should be nearly full open. At 20.0 mA it should be fully open, and hard open at 20.2 mA (resting on the travel stop). Tests of this nature will determine if the valve is opening and closing correctly, but still fall short of testing the valve across the entire range where it provides control.
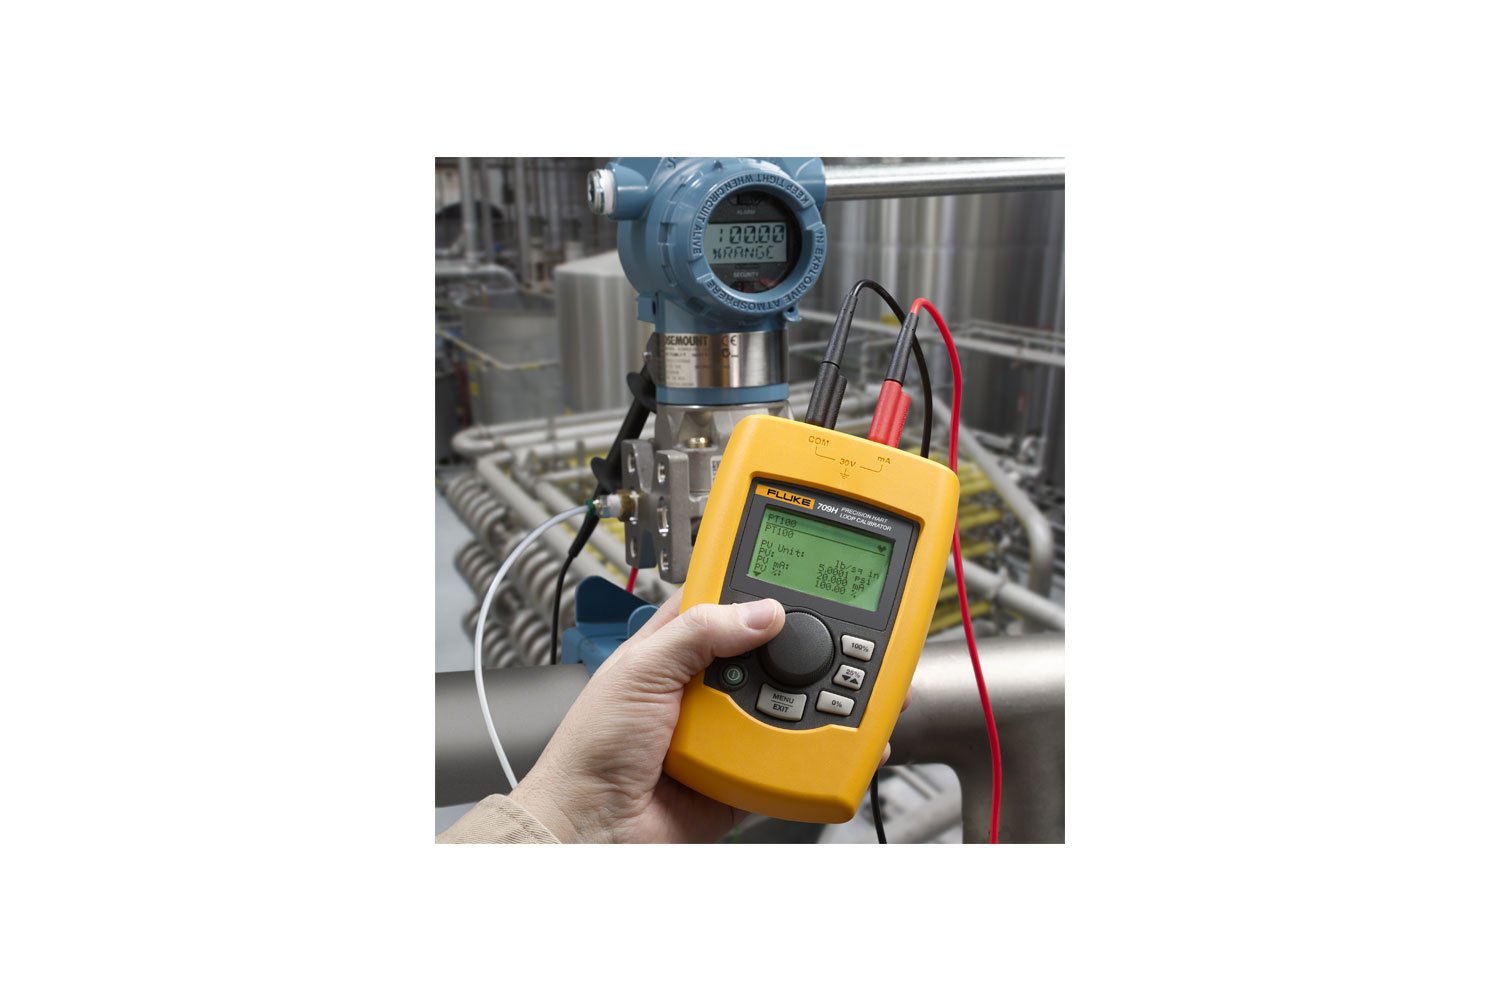
Many valves, including those that are "smart," have a feedback element built in that outputs the actual position as a percentage of open/close. This output can be a 4 to 20 mA signal or a digital HART variable that represents 0 to 100 percent of control valve operating span. Applying a varying mA signal, while simultaneously monitoring the output mA or percentage of span signal, gives a technician a means to see whether a control valve is operating correctly over its range. By recording simultaneously the applied mA signal and the output mA signal or PV percentage of span, the valve's performance can be documented. This documented test and result is often called a valve's "signature." The output should smoothly mirror the applied mA input signal. Any deviation from the applied signal is a potential indication of aberrant behavior by the valve.
Maintenance strategy can reduce costs
Jim Shields, product marketing manager at Fluke, says a best-in-class maintenance strategy for control valves can reduce costs by both minimizing the number of valves pulled physically from processing and minimizing failure risks. Here's his advice. To establish such a practice, the baseline condition of the valve at a known good state needs to be documented. Ideally the documentation occurs when the valve is commissioned or after it is overhauled. The technician records the signature of the valve in the ideal state, plotting the output mA or percentage of span signal versus applied input signal, and stores this information with the time, tag number of the valve, and the date the activity is performed. Calibration management software can be used to manage this information.
Once the baseline performance signatures of the valves are recorded, a maintenance interval for testing the performance of the valves needs to be established. Using existing maintenance intervals is a starting point. If there is no established maintenance interval, the service location of the valve needs to be evaluated. Rough service applications dictate a shorter maintenance interval than light duty service, for example. An interval of six months to a year to start (unless the service location is very hard on the valves) is a reasonable starting point. Some devices installed in safety and shut-down systems need to be checked every three months regardless of service location.
Once baseline valve signature data is recorded, the valves need to be tested at the defined intervals and the signatures recorded. The signatures can be compared to the baseline signatures to determine changes in their performance. If the output response curve has developed a nonlinear signature or has aberrations in the curves, the valve may be developing excessive stiction or hysteresis that may require it to be removed for service.