Nothing beats good, solid data. The ability to visualize asset health across the entire system you’re responsible for is priceless. Good data about your assets helps you control downtime and minimize costs.
Regularly scheduled testing of assets, such as motors, will accumulate useful data over time. You can identify trends and plan system downtime for maintenance or service. Preventive maintenance is a proactive approach that relies heavily on data collection and analysis.
Test data are snapshots of moments in time. Your team can analyze accumulated data using different perspectives and expertise to discover trends and issues, determine next steps, and approve asset repair or replacement. When your whole team has access to the data, you’re less likely to have unplanned downtime.
Testing insulation resistance in motors
Wire insulation coating inside motors deteriorates over time and with typical wear and tear. One way to identify insulation deterioration is by analyzing current data collected over time. When insulation deteriorates or has been damaged, current will leak into parts of the motor it shouldn’t, causing undo wear. The insulation keeps the current flowing along the wire exactly as intended.
Insulation resistance testing of motors focuses on capacitance and current leakage. Timed ratio tests (spot tests) are used to detect insulation resistance and include the polarization index (PI) and dielectric absorption rate (DAR). Fluke’s insulation resistance testers automatically calculate the PI and DAR with no additional setup. The test data will identify changes in current over the specified period, then produce a comparison in terms of a ratio.
For example, if the current flow after 10 minutes is the same after 1 minute, that ratio would be 1:1. This ratio would be highly uncommon, however, because many other factors play a role in how current flows, including voltage and temperature. Since both voltage and temperature are not steady, they must be compensated for in determining actual insulation resistance performance.
Data collected during insulation resistance testing will included the following, at a minimum:
- Insulation resistance values
- Testing time stamps
- Contextual information
- Output test voltages
- Test durations
- Temperature compensations
Why insulation resistance data matters
In this example, a maintenance technician has been testing a motor using the Fluke 1550C FC Insulation Resistance Tester combined with Fluke Connect® technology to test for capacitance and current leakage.
- He instantly collects and saves data to a cloud server where the maintenance manager responsible for system uptime can immediately see and analyze the data from his PC or laptop.
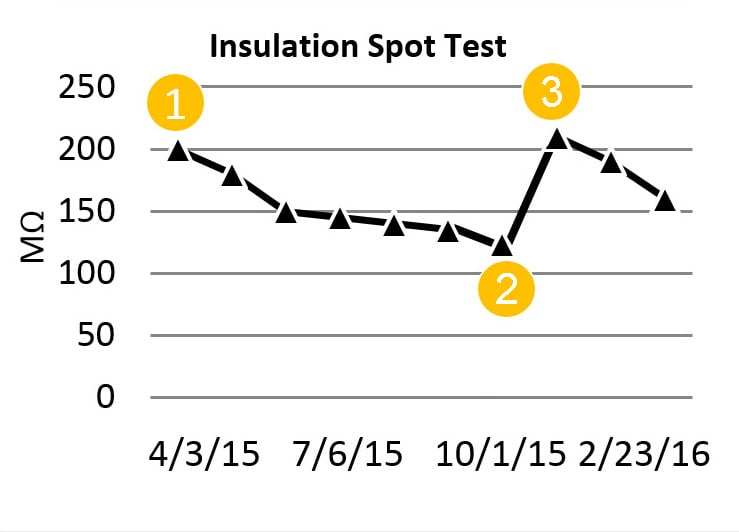
- Data collected over time identifies a gradual decline in insulation resistance, or current leakage. Once the data has dropped to or below a predetermined minimum threshold, the maintenance manager knows the motor needs service.
- Service is scheduled for when it will have the least impact on system production.

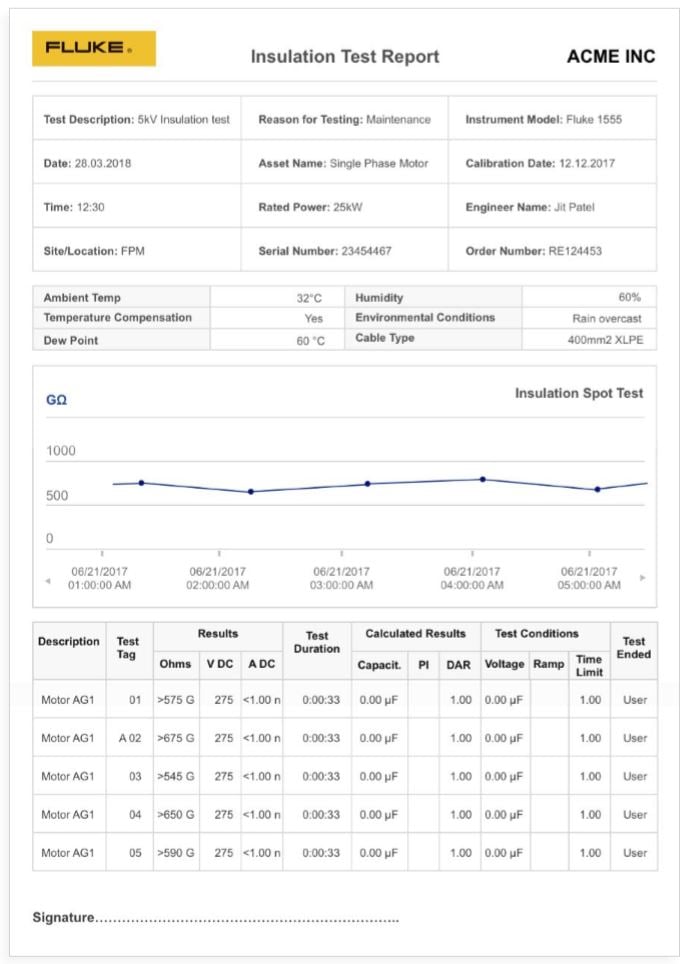
For his records, the maintenance manager creates a simple report using the Fluke Connect application that shows all relevant motor data. Reports act as proof of testing and include trendlines that are easy to read and understand — perfect for sharing with clients or facility managers. Fluke Connect makes the job of data collection and analysis less difficult with drag and drop report creation.
Benefits of data sharing
Being able to share data among a team of stakeholders and experts means more efficient preventive maintenance programs, broader system insight, and easier decision making.
