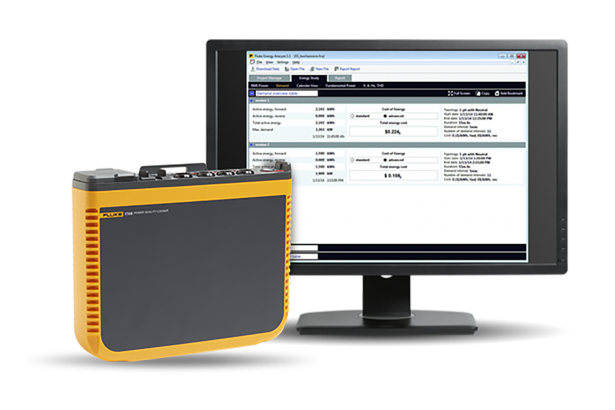
Fluke Energy Analyze plus software
主な機能
Whether you are looking to compare local conditions, benchmark against best-in-class facilities, or create a complete picture using multiple studies captured at the same time Fluke Energy Analyze plus gives you the analysis power you need.
Purpose built data views
- Energy or Load Studies: RMS Power, Demand, Fundamental Power, V, A, Hz, THD and Calendar View grouped data hourly, daily or weekly
- Power Quality Study: Event tables and waveforms, Harmonics, PQ Health Dashboard, Flicker and Mains Signaling
- Reporting: Create Bookmarks and build reports on the fly. With a Fluke 1746 or 1748 create industry standard report with one-click, reduce time and minimize complexity
- Export Data and build custom graphs using different session data or measurements
Flexible Analysis Tools
- Import multiple session data from any period – overlay data sets to compare and identify changes or abnormalities
- Cursors and markers to measure specific points of interest
- Plot multiple measurement parameters either individual or all phases, in addition add min or max trend lines.
- Automatically or manually scale each axis. Lock or unlock time axis scaling to synchronize trend graphs by time or process sequence
製品概要: Fluke Energy Analyze plus software
Fluke Energy Analyze plus is a powerful software package designed to simplify the downloading, analysis, tracking and reporting of power quality and energy data. This software application includes easy-to-use data analysis tools to help you gain valuable insights into what’s going on with power quality and energy consumption in your facility. Compatible with the Fluke 1732, 1734, 1736, 1738, 1742, 1746 and 1748 power and energy loggers Fluke Energy Analyze plus gives you the flexibility and data analysis capabilities you need to make better maintenance and facility management decision—from the service entrance to critical loads, and everything in between.

