The digital multimeter is the mainstay of electrical troubleshooting and the tool that most of us reach for first. In Beyond the Multimeter, we look at five examples of how reaching for an oscilloscope next can make troubleshooting faster, easier, and more effective.

Part 3 describes troubleshooting a rotary encoder that controls a conveyor belt that has been operating erratically.
What's wrong with the conveyor system?
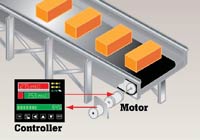
A rotary encoder converts the position of a rotating shaft into a digital signal. In this example, the digital signal from a rotary encoder is used to monitor the movement of a conveyor belt (see Figure 1). The conveyor belt has started behaving erratically - most notably when the conveyor speeds up - but it's not clear if the problem lies with the rotary encoder or the with controller that operates the conveyor belt.
Troubleshooting with a multimeter


The output of a rotary encoder is a series of digital pulses. In this example, the pulses are monitored by a controller that uses them to control the speed and position of the conveyor system to which the encoder is attached.
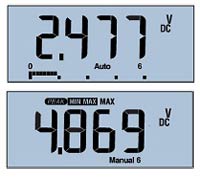
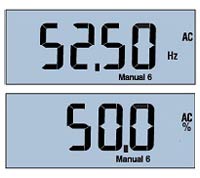
Measurements with a digital multimeter can reveal the voltage, frequency, and duty cycle of the signal from the rotary encoder. When you connect the multimeter to the encoder output, you get the values shown in figures 2 and 3.
All of the values - average and peak voltage, frequency, and duty cycle - appear to be normal. The controller's programming hasn't been modified and has worked well for years, so chances are that's not the problem.
Because none of the measurements that you can take with a multimeter reveal a problem, it's time to consider a tool that gives more information.
Troubleshooting with an oscilloscope
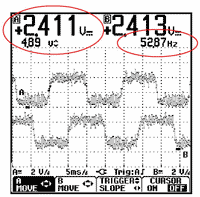
When a digital oscilloscope is connected to the output of the rotary encoder, it can display the signal's average voltage (2.411 V), peak voltage (4.89 V) and frequency (52.87 Hz), just like a multimeter. However, an oscilloscope also displays voltage, as it varies over time, as a line that sweeps from left to right across the screen (see Figure 4). In this example (see Figure 5), the line is jagged and electrically "noisy" - a clear sign of trouble that can arise when there is inadequate shielding on a signal line.
When the oscilloscope is connected to the output of the controller, it reveals nothing out of the ordinary about the controller output pulses. The pulse waveforms are well-formed and free from electrical "noise." (Figure 4)
What about timing? Next we connect the oscilloscope so it captures the signals from the proximity switch on first channel and the output pulse from the controller on the second channel (Figure 5). When we examine the result, it's immediately clear that something is wrong. The bottom trace (the output from the proximity switch) is not stable in relation to the top trace (the controller output).
An oscilloscope displays varying voltages as a line (called a "trace") that sweeps from left to right across the screen. If this line is drawn faster (that is, if we increase the oscilloscope's sweep speed), we can see a more detailed view of how the voltage is changing moment by moment (or millisecond by millisecond).
"Zooming in" on the signals in this way (Figure 6) reveals that the output from the proximity switch (lower trace) isn't changing from off to on in a single transition (red circle). Instead, faulty switch contacts are bouncing on and off for about five milliseconds before the output stabilizes. The controller is unable read this jagged voltage correctly, so its output varies broadly (over the time range shown by the red bars in the top trace). That's what's causing the erratic behavior.
The bottom line
While a digital multimeter can give you precise values for voltage, frequency, and duty cycle, only an oscilloscope can show you the behavior of electrical signals, making troubleshooting faster and easier. A picture really is worth a thousand words!
- Beyond the Multimeter, Part 1: Troubleshooting a Variable Frequency Drive with a Multimeter and an Oscilloscope
- Beyond the Multimeter, Part 2: Using a Multimeter and an Oscilloscope to Troubleshoot Transient Voltages in Variable Frequency Drive Output
- Beyond the Multimeter, Part 4: Troubleshooting a Proximity Switch with a Multimeter and an Oscilloscope
- Beyond the Multimeter, Part 5: Troubleshooting a DC Power Supply with a Multimeter and an Oscilloscope