By Chuck Newcombe

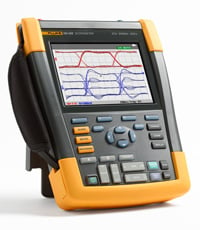
This is the first question that popped into my mind as I read the press release for the new Fluke 190-502 ScopeMeter® Test Tool, with a bandwidth of a sizzling 500 MHz.
The second question that came to mind was, "What kind of rise time might I be able to see on the digital control signals of pulse width modulation (PWM) motor drives?"
Rise time versus bandwidth
The first question led me to recall the old standby estimates I have used for over 40 years to compare these two specifications. The formula can be stated in two ways, depending on what you're looking for. It is usually applied to the leading edge of a pulse in a dynamic system and is related to resistor-capacitor filter time constants and settling times.
- Rise time (in seconds) = 0.35/bandwidth (in Hz), or
- Bandwidth (Hz) = 0.35/rise time(s)
Applying (1) above to the specs of the new Fluke 190 Series II ScopeMeter reveals that at 500 MHz, one should be able to accurately determine rise times as fast as 700 picoseconds (0.7 nanoseconds).
How accurate is the estimate I've been using all these years for sine waves?


I decided I needed to better understand the roots of the old rule of thumb that uses the constant 0.35, as it applies to sine waves. So, the next question to be answered is, "What is the rise time of a 500 MHz sine wave relative to its period?"
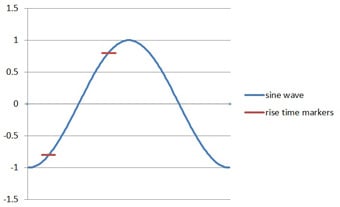
Rise time is defined as the time required for a signal to move from 10% to 90% of a rising waveform. See Figure 1.
For the sine wave pictured here, the 10% to 90% time on a 2 V p-p signal at 500 MHz would take about 700 picoseconds using the 0.35 rule of thumb.
I found that there are 108 degrees between the markers, and 108/360 = 0.3, so one might consider using 0.30 as the constant for calculation. Upon further inspection, and since the fastest rate of change occurs through zero, I think the rise time of a 500 MHz sine wave is actually closer to 600 picoseconds. The extended slope through zero can be seen in Figure 2.
So where does this leave us in the real world - in motor drive switching circuits?
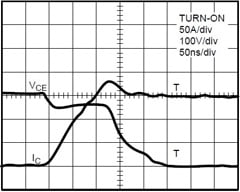
Let's take a look at some typical switching waveforms for an insulated gate bipolar transistor (IGBT) used in today's motor drives.


Typical voltage and current turn-on waveforms are shown in Figure 3. Note that the voltage initially drops about 50 volts in 10 to 20 nanoseconds (ns). It then holds steady as the current slowly builds over about 125 ns. The voltage then drops another 250 volts as the current stabilizes at 150 A.
Based on the above, the new Fluke 190-502 has the margin it needs in its bandwidth and rise time capabilities for this application. Perhaps the biggest problems would be in finding a very low inductance current shunt for the current measurement, and making sure you have carefully compensated voltage probes to minimize induced ringing.
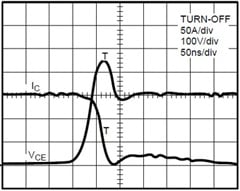
These considerations become even more important to accurately measure the turn-off waveforms. See Figure 4.
Here, the voltage slews from zero to a 450 V peak in about 50 ns, and the current drops from 150 A to zero in an equal period of time.
Keep measurement safety in mind
The magnitudes of the voltage swings pictured here remind us of the importance of the CAT IV 600V rating of the new ScopeMeter. With the amount of energy available, and the possibility of ringing on the cables between a drive and a motor, we can't be too cautious.
So should we use 0.30 or the time-honored 0.35 for determining the relationship between rise time and bandwidth?
Recall that the specification for bandwidth indicates that frequency where the amplitude of the applied signal has already been attenuated by about 30% by the roll-off of the analog amplifiers and divider networks ahead of the oscilloscope's a/d converter. Associated with that roll-off is a phase shift of the signal of 45 degrees.
Taking these considerations into account, my advice is to continue to use the more conservative 0.35 constant to determine equivalent rise times.
Perhaps an even better, and much more conservative, approach is to consider the stated bandwidth to be that of a fifth harmonic of the frequency you want to measure. A fifth harmonic, likely present in a typical pulse, might begin to become attenuated at the stated bandwidth. That would indicate that we can rely on a 500 MHz bandwidth oscilloscope to show a full and undistorted picture of the input at about 100 MHz, maintaining good fidelity of the signal you're trying to measure.