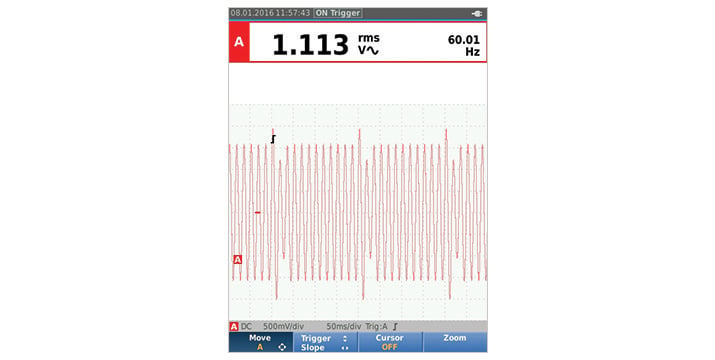
The task of capturing and analyzing an unknown waveform on an oscilloscope can be routine, or it can seem like taking a shot in the dark. In many cases, taking a methodical approach to oscilloscope set up will help capture a stable waveform.
Traditional manual method of waveform setup
The traditional method of getting a signal to show properly on an oscilloscope is to manually adjust three key parameters to try to achieve an optimum setpoint—often without knowing the correct variables:
- Vertical sensitivity. Adjusts the vertical sensitivity so that the vertical amplitude spans approximately three to six divisions.
- Horizontal timing. Adjusts the horizontal time per division so that there are three to four periods of the waveform across the width of the display.
- Trigger position. Sets the trigger position to the 50% point of the vertical amplitude. Depending on the signal characteristics, this action may or may not result in a stable display.
Those three parameters, when adjusted properly show you a symmetrical “trace,” the line that visually depicts the waveform. Waveforms can vary indefinitely from the sine-wave to a unidirectional square to a shark tooth form.
The manual setup method often requires tediously adjusting the settings to make the waveform readable in order to analyze it.

Unknown trace adjusted for 3-6 vertical divisions

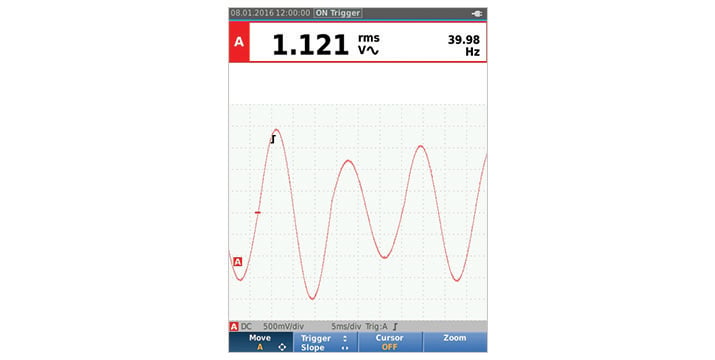
Unknown trace adjusted for 3-4 periods horizontally

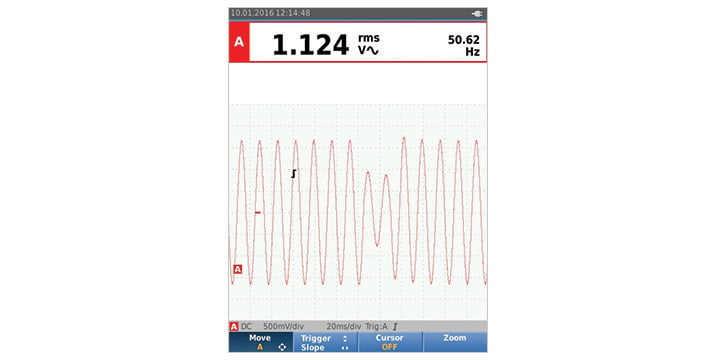
Trigger point is set to the 50 % point but due to the aberration on the leading edge in the second period, an additional trigger results in an unstable display

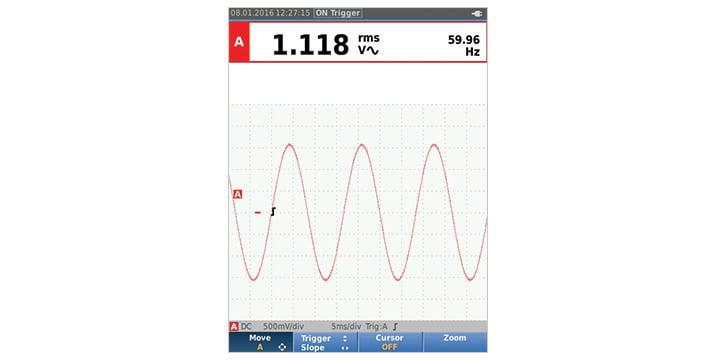
Trigger level adjusted to a unique repetitive position, outside the aberration on the second period.
Automating waveform setup
In contrast to the manual approach, Fluke ScopeMeter® Hand-held Oscilloscopes include a technology called Connect-and-View™ that automates the process of digitizing the analog waveform to see a clear picture of the signal. Connect-and-View adjusts the vertical and horizontal timing and the trigger position for you, enabling hands-off operation to display complex unknown signals. This function optimizes and stabilizes the display on nearly all waveforms. If the signal changes, the setup will track these changes.
By pressing the AUTO button you enable Connect-and-View. At this point you should see a trace that 1) lies within the vertical range of the display, 2) shows at least three periods of a waveform, and 3) is stable enough to allow you to recognize the overall characteristics of the waveform.
This automated approach helps establish a readable representation of the signal thus more efficient troubleshooting. Some combination of automated and manual tuning may be necessary for the best results, however.