Four keys to understanding motor efficiency, and causes for failures
Electric motors transfer electrical power to mechanical rotational forces that are the muscle of the industrial world. Measuring and analyzing those forces—mechanical power, torque and speed—as well as power quality characteristics are important to assessing performance of rotating equipment. These measurements can not only help predict failure and thus help avert downtime, they can also help quickly determine whether additional inspections, such as vibration testing, shaft alignment analysis or insulation testing, are needed to corroborate the findings.
Traditionally, obtaining accurate motor analysis data required costly equipment shutdowns to allow for the installation of mechanical sensors. Not only can it be extremely difficult (and sometimes impossible) to properly install mechanical sensors, the sensors themselves are often cost prohibitive and introduce variables that decrease overall system efficiency.
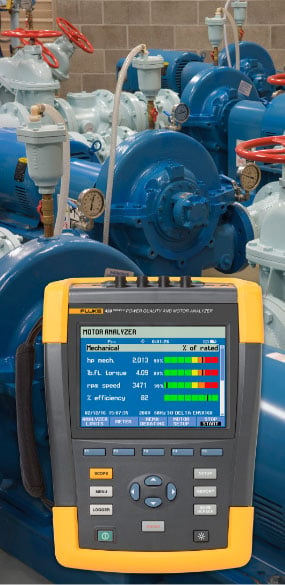
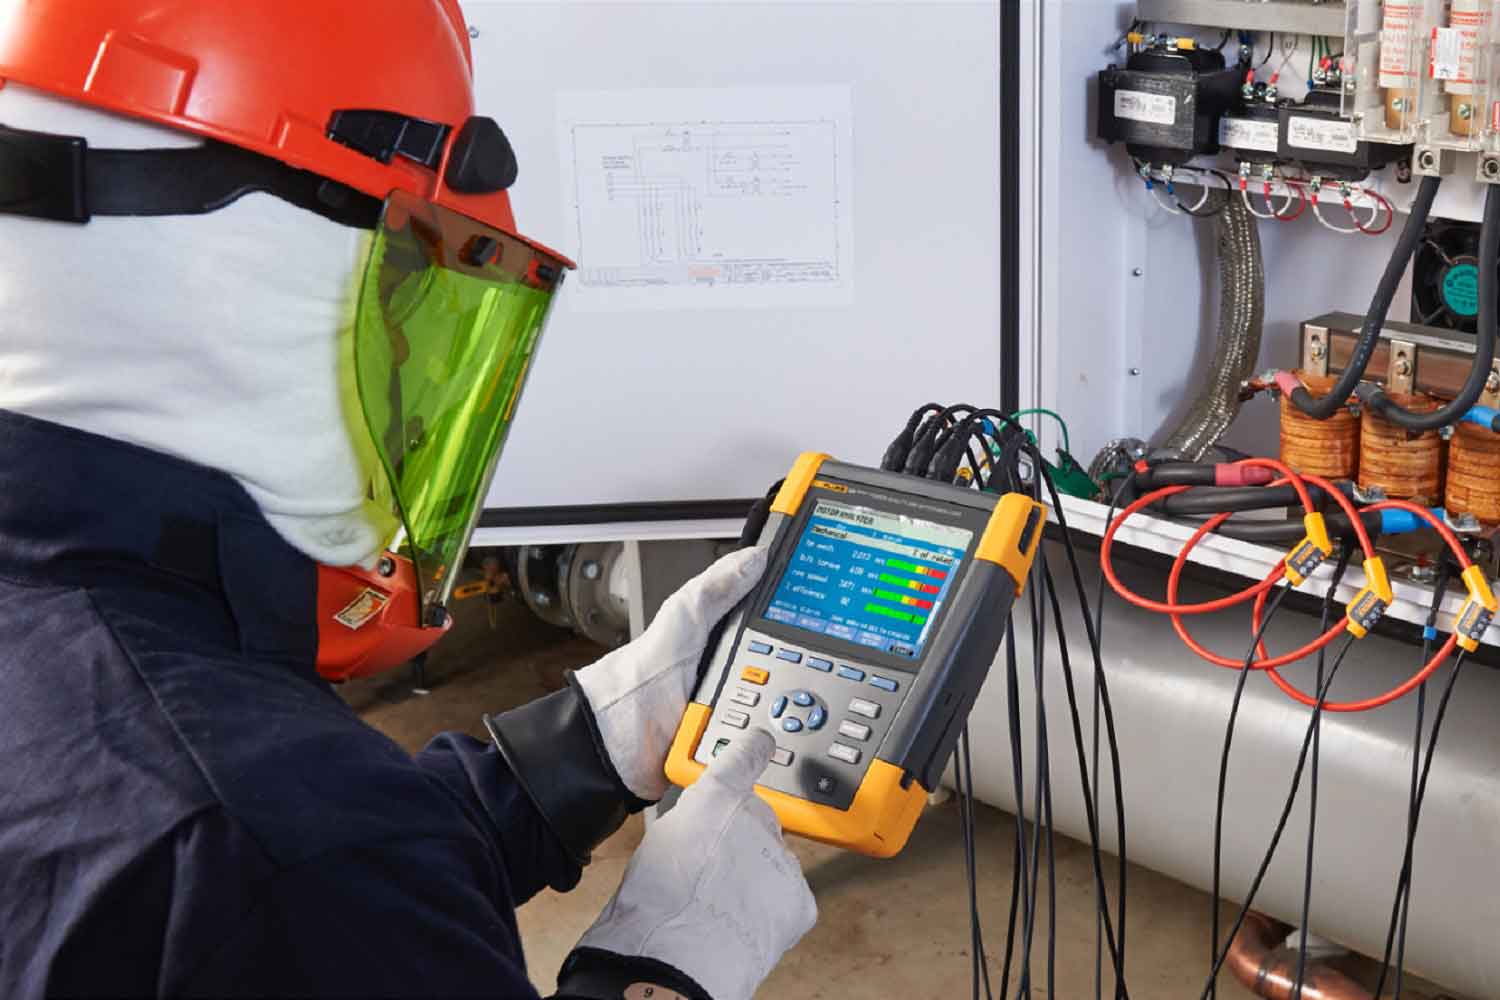
Modern motor analysis tools make it easier than ever to troubleshoot electric motors by significantly simplifying the process and reducing the number of components and tools necessary to make critical maintenance decisions. For instance, the new Fluke 438-II Power Quality and Motor Analyzer enables technicians to discover electrical and mechanical performance of electric motors, and evaluate power quality by measuring the three-phase input to the motor, without mechanical sensors.

Here are FOUR KEYS to understanding overall motor efficiency and system performance.
1. Poor power quality has a direct correlation with motor performance
Power anomalies such as transients, harmonics, and unbalance can cause critical damage to electrical motors. Power anomalies such as transients and harmonics can be detrimental on motor operation. Transients can cause serious damage to motor insulation and can also trip overvoltage circuits, causing monetary losses. Harmonics, which create distortion of both voltage and current have a similar negative impact and can cause motors and transformers to run hot, potentially leading to overheating, or even failure. In addition to harmonics, unbalance can occur in both voltage and current, and is often the root cause of elevated motor temperature and long term wear including burnt windings. Using three-phase measurements on the motors input, technicians capture the broad range of data that can help indicate the overall state of power quality health helping them better troubleshoot the root causes of motor inefficiency.
2. The impact of torque on overall performance and efficiency
Torque is the amount of rotational force developed by a motor and transmitted to a driven mechanical load, while speed is defined as the rate at which a motor shaft is rotating. A motors torque, measured in pound feet (lb ft) or Newton meters (Nm), is the single most critical variable that characterizes instantaneous mechanical performance. While traditionally mechanical torque has been measured with mechanical sensors, the Fluke 438-II calculates torque using electrical parameters (instantaneous voltage and current) in combination with motor rating plate data. Measuring torque can give a direct insight in to the state of health of the motor, the load and even the process itself. By ensuring the motor is running at the torque level within the stated specification ensures reliable operation over time and minimizes maintenance costs.
3. Motor rating data and expected performance
Motors are classified by NEMA (National Electrical Manufacturers Association) and IEC (International Electrical Commission) rating data. These ratings include key electrical and mechanical parameters such as rated motor power, full load current, motor speed, and nominal full load efficiency and provide a description of the overall expected motor performance under normal conditions. Using sophisticated algorithms, modern motor analysis tools are able to compare three-phase electrical measurements with the rated values to provide insight into the motors performance under real load conditions. The difference between running a motor within the manufacturer’s specification or outside those parameters is significant. Running motors in mechanical overload conditions causes stress to motor components including bearings, insulation and couplings decreasing efficiency and leading to premature failure.
4. Motor efficiency has a direct impact on the bottom line
More than ever, industry is striving to reduce energy consumption and increase motor efficiency through “green” initiatives. In some countries these green initiatives are becoming law. One recent study said motors consume 69 % of all industrial electricity and 46 % of all global electricity consumption. By identifying poorly performing or faulty motors and either repairing or replacing them, you keep energy consumption and efficiency in check. Power quality and motor analysis provides data to identify and confirm excess energy consumption and inefficiencies. Plus, the same analytics can verify the improvements upon repair or replacement. In addition, knowing the condition of motors and being able to intervene before failure also reduces exposure to potential safety and environmental incidents.

Power quality and motor data are not static. As conditions change, so do measurements. Motor failures were recently identified by 75 % of respondents to an industry survey as causing 1 to 5 days of plant downtime a year, and 90 % of respondents reported failures of larger 50 hp motors with less than a month warning (36 % said they had less than a day warning). Collecting baseline data is a first step to a predictive or preventive maintenance program. Begin with accurate baseline readings of motors and then take subsequent measurements and track trends. For the best results, the measurements are made under consistent, repeatable operating conditions, ideally at the same time of day, in order to create like-kind comparisons. Such methodology can be adopted with power quality data (harmonics, unbalance, voltage, etc.) as well as motor analytics (torque, speed, mechanical power, efficiency).
The new Fluke 438-II Power Quality and Motor Analyzer makes it easy to gather baseline data on direct-on-line motors, and detect mechanical and electrical faults without having to introduce system downtime into the workflow. To measure the performance of motors which are powered by variable frequency drive systems the drive must be a voltage controlled system (VSI) with a voltage / frequency range of 40 to 70 Hz, and a carrier range of 2.5 kHz to 20 kHz. By adding electrical and mechanical analysis of electric motors to your tool belt you can ensure that you have the data you need to help keep your plant up and running.
7/2017 6007781b-en