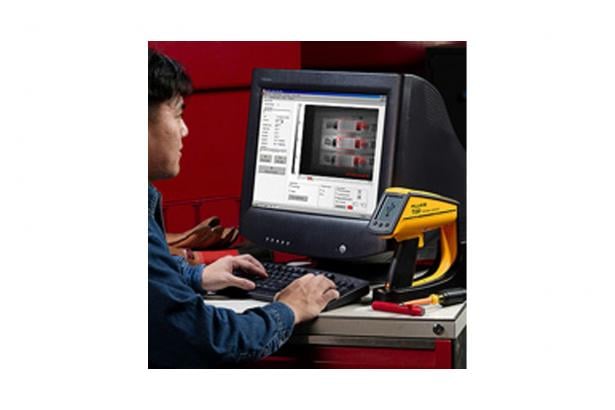
Product overview: Fluke InsideIR™ Software Europe
For Fluke Ti20/Ti30 Thermal Imagers
Fluke InsideIR software is included with each Fluke thermal imager. This powerful software package allows the user to store and analyze thermal images and associated data, create inspection routes, adjust key measurement parameters, and report findings.
Image and data storage
Thermal images taken in the field are easily uploaded and stored into the InsideIR software. An image gallery (see figure 1) gives a quick overview of the measurements taken in a given session. All images are date and time stamped, contain location information, and are stored with associated data such as temperatures for every pixel in the thermal scene and imager settings for that location.
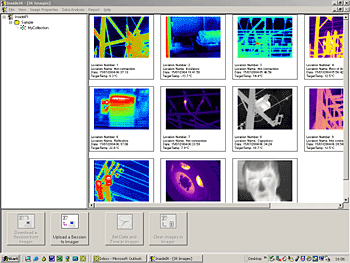
Detailed analysis
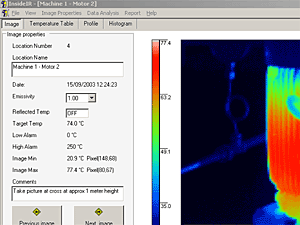
Just double-click an image to perform a detailed analysis (Figure 2a and 2b). See temperature readings at any point in the scene, or select an area of interest. The maximum, average and minimum temperature of the selected area is displayed.
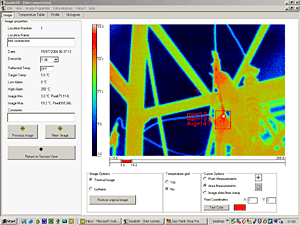
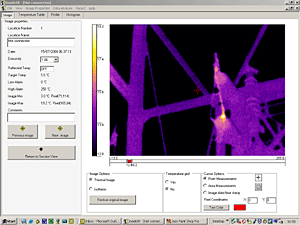
To perform accurate in-depth analysis and to pin-point hot spots, InsideIR software allows adjustment of image parameters without the need to re-scan equipment. The user can adjust :
- Temperature level and span
- Palette settings
- Emissivity
- Reflected temperature correction values
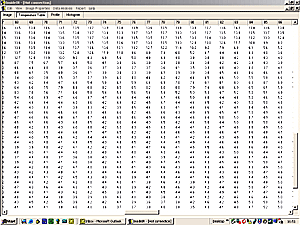
Fluke thermal images are fully radiometric, and a temperature table containing temperature readings for every pixel in the scene (see figure 3) can be downloaded and imported to popular spreadsheet programs like Microsoft Excel.
Creating inspection routes
Predictive maintenance programs rely on periodic inspections of critical plant equipment. The InsideIR software allows the development of a regular program by defining the route of equipment to be inspected (see figure 4). By assigning unique location names, inspection notes and key infrared parameters, a routing sequence can be defined and uploaded to the thermal imager. On-camera instructions prompt the user to the exact location where to take images. New images and associated location data are easily compared to previous scans, helping to identify potential problems before they cause failure.
Creating reports
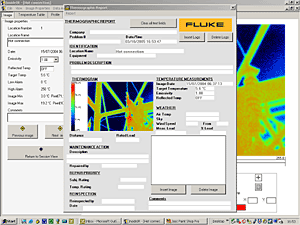
With the click of a mouse, a professional thermographic report will be created (see figure 5). The user can insert a description of the problem and the action to be taken. The report includes the thermal image, as well as a place for a digital photograph, if available.
Minimum System Requirements
Personal computer with a Pentium® III processor, 700 MHz or higher. (Pentium® 4 processor at 2.80GHz recommended)
- 512 megabytes (MB) of RAM (higher recommended)
- 500 MB of free hard disk space
- SuperVGA monitor with the screen resolution set at 1024 x 768 or greater; small fonts setting; and true color (32 bits)
- CD ROM drive
- USB rev. 2.0 port
- Mouse or pointing device
One of the following operating systems, updated with the latest packages
- Microsoft® Windows® XP SP 1 with Internet Explorer version 6.0 or greater
- Microsoft® Windows® 2000 SP 4 with Internet Explorer version 5.01 or greater
*Note: the latest version of Internet Explorer can be found on Microsoft's Web site at
- Microsoft® Windows® XP SP 1 with Internet Explorer version 6.0 or greater
- Microsoft® Windows® 2000 SP 4 with Internet Explorer version 5.01 or greater
http://www.microsoft.com
- Microsoft .NET Framework 1.1 (is included on InsideIR installation Package)
- Microsoft MSDE 2.0 (is included on InsideIR installation Package)
- Printer, optional for printing reports
